Tohoku Dataset
The second dataset used in this study is contributed by students at Tohoku University.
Minimal Example
# -------------------------------------------------------------------------
# STEP-1: LOAD LIBRARIES
# Base libraries
import os
from pathlib import Path
# Database library
import duckdb
# Custom osbad library for anomaly detection
import osbad.config as bconf
from osbad.database import BenchDB
# -------------------------------------------------------------------------
# STEP-2: LOAD CELL INVENTORY FOR CELL_INDEX
# Path to the DuckDB instance:
# "train_dataset_severson.db"
db_filepath = (
Path.cwd()
.parent
.joinpath("database","train_dataset_severson.db"))
print(db_filepath)
# Create a DuckDB connection
con = duckdb.connect(
db_filepath,
read_only=True)
# Load all training dataset from duckdb
df_duckdb = con.execute(
"SELECT * FROM df_train_dataset_sv").fetchdf()
unique_cell_index_train = df_duckdb["cell_index"].unique()
print(unique_cell_index_train)
# Get the cell-ID from unique_cell_index_train
selected_cell_label = "2017-05-12_5_4C-70per_3C_CH17"
# Create a subfolder to store fig output
# corresponding to each cell-index
selected_cell_artifacts_dir = bconf.artifacts_output_dir(
selected_cell_label)
# -------------------------------------------------------------------------
# STEP-3: LOAD BENCHMARKING DATASET
# Import the BenchDB class
# Load only the dataset based on the selected cell
benchdb = BenchDB(
db_filepath,
selected_cell_label)
# load the benchmarking dataset
df_selected_cell = benchdb.load_benchmark_dataset(
dataset_type="train")
if df_selected_cell is not None:
filter_col = [
"cell_index",
"cycle_index",
"discharge_capacity",
"voltage"]
# Drop true labels from the benchmarking dataset
# and filter for selected columns only
df_selected_cell_without_labels = benchdb.drop_labels(
df_selected_cell,
filter_col)
# Extract true outliers cycle index from benchmarking dataset
true_outlier_cycle_index = benchdb.get_true_outlier_cycle_index(
df_selected_cell)
print(f"True outlier cycle index:")
print(true_outlier_cycle_index)
# -------------------------------------------------------------------------
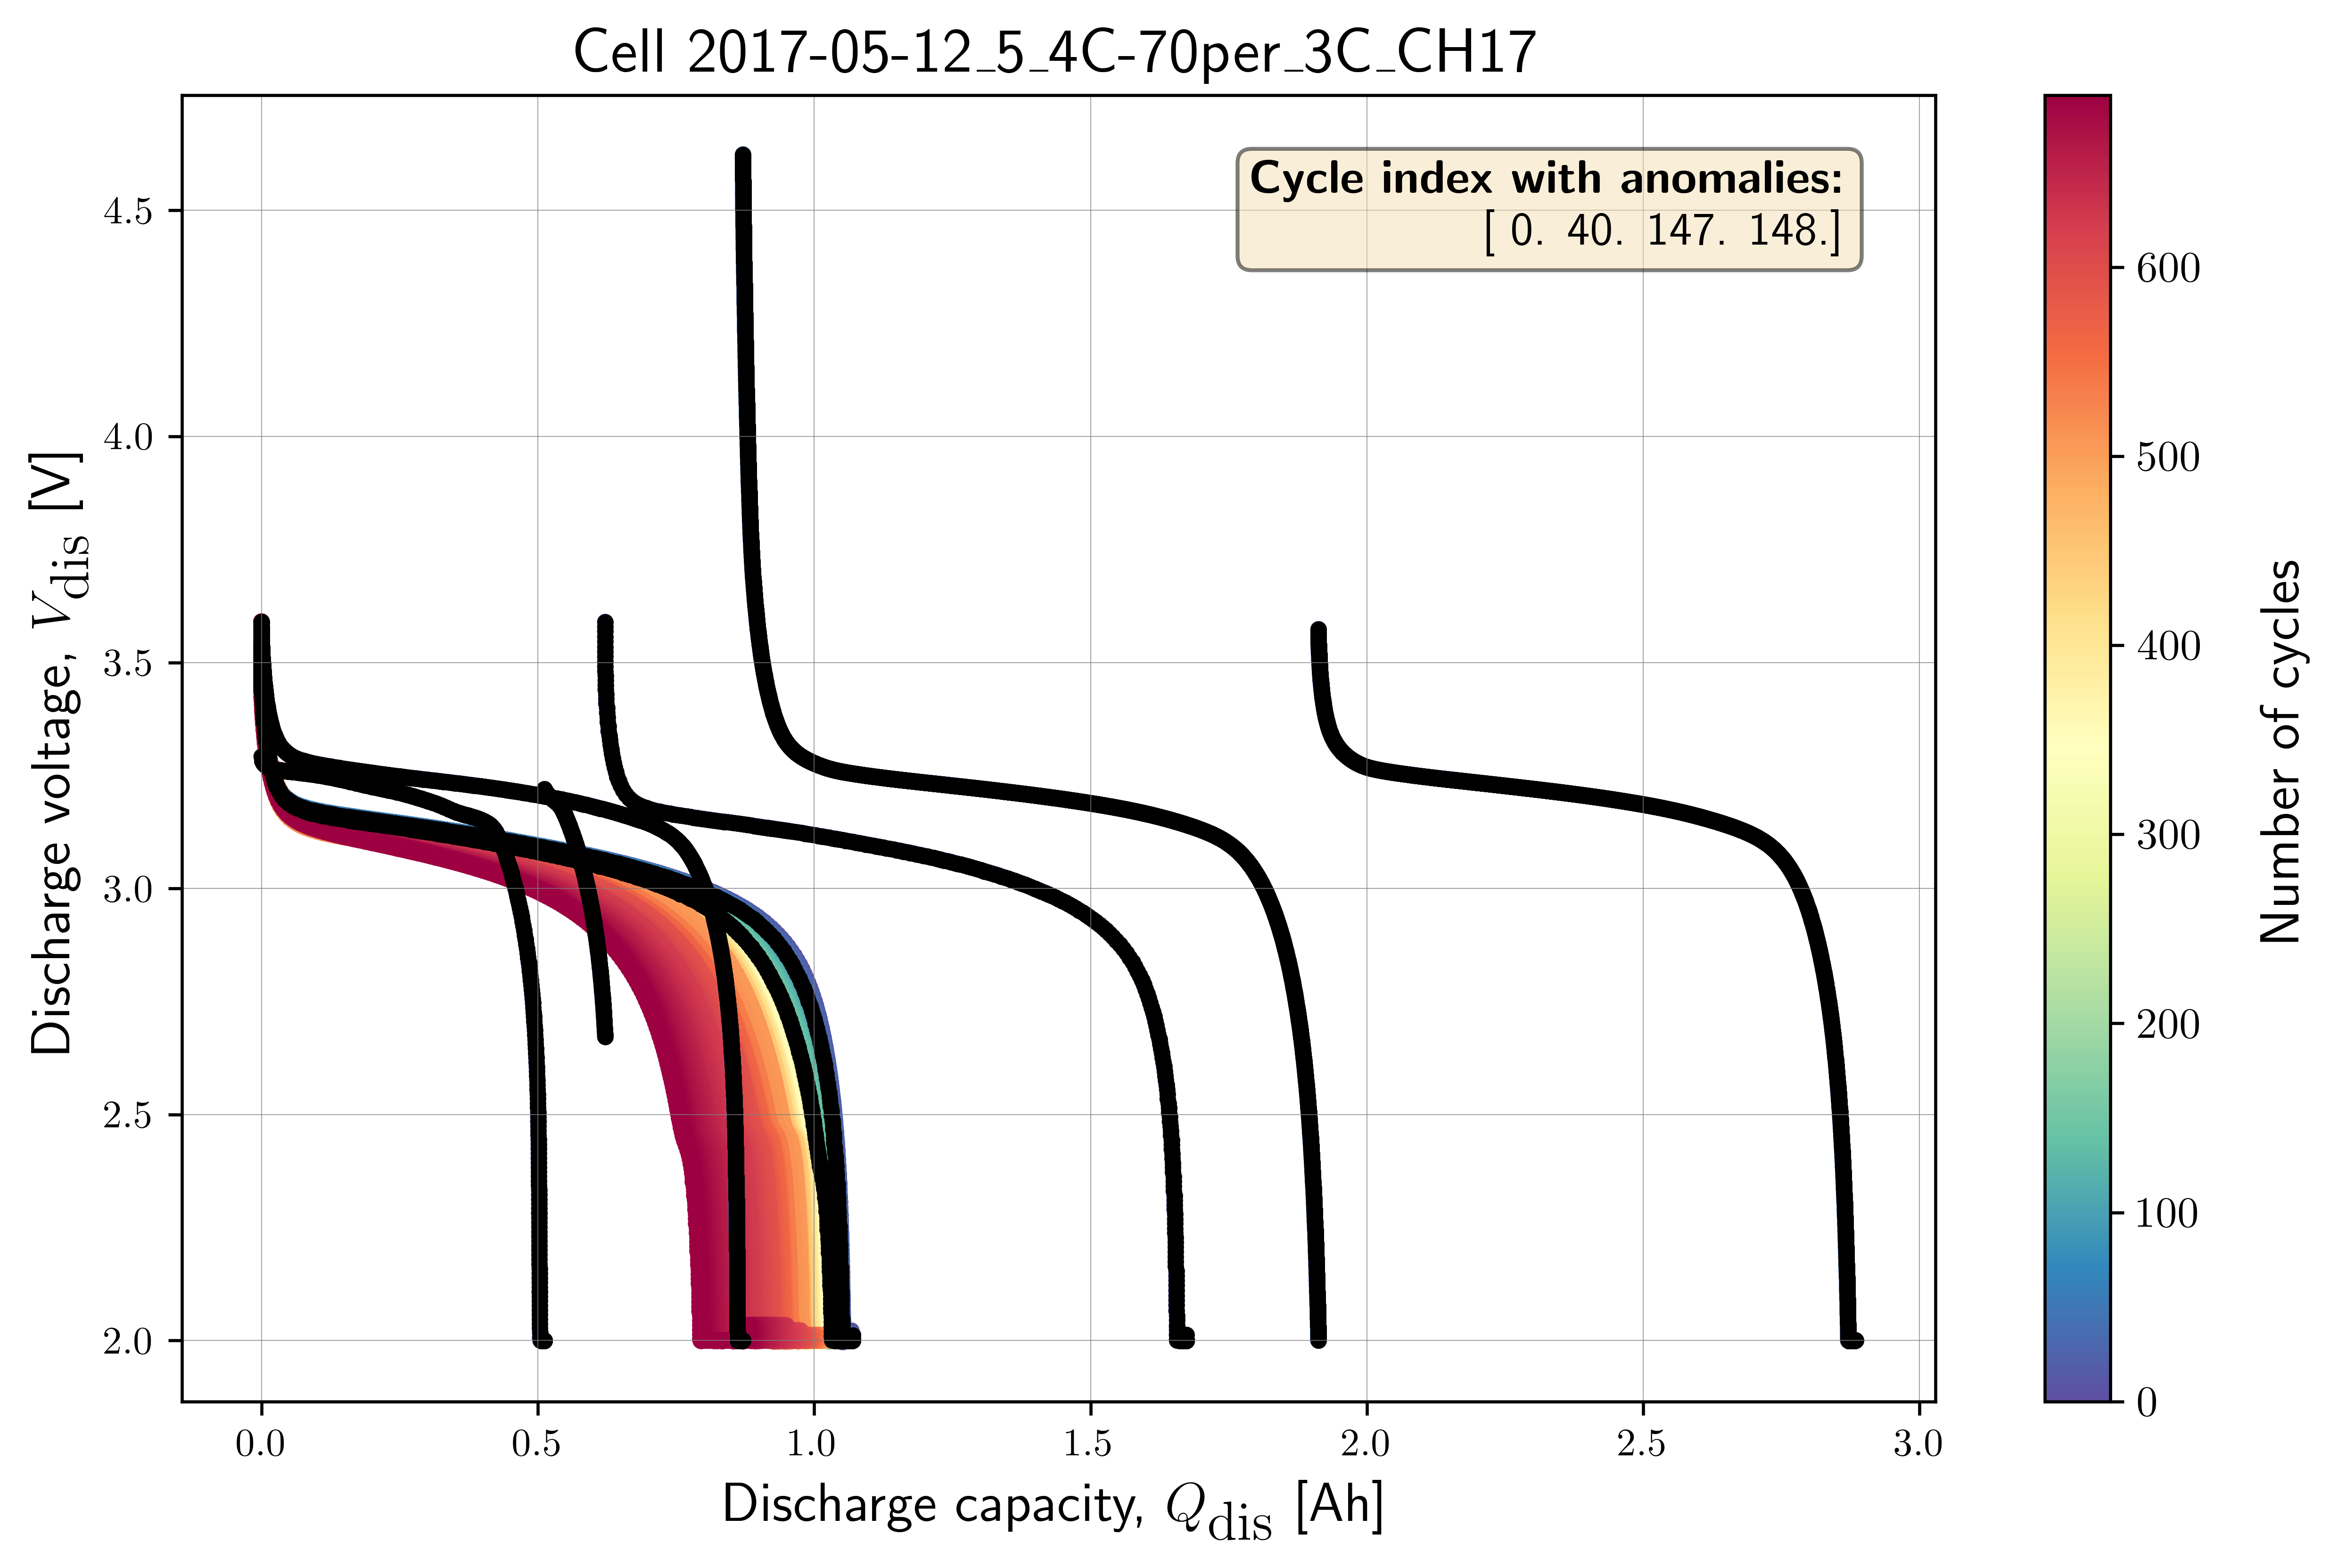
# STEP-4: PLOT CYCLING DATASET
# Plot cell data with true anomalies
# If the true outlier cycle index is not known,
# cycling data will be plotted without labels
benchdb.plot_cycle_data(
df_selected_cell_without_labels,
true_outlier_cycle_index)